

MPAndroidChart¿ªÔ´Í¼±í¿âÖ®±ý״ͼ
¡¡¡¡Îª´ó¼Ò½éÉÜÒ»¿îͼ±ê¿ªÔ´¿âMPAndroidChart,Ëü²»½ö¿ÉÒÔÔÚAndroidÉ豸ÉÏ»æÖƸ÷ÖÖͳ¼Æͼ±í£¬¶øÇÒ¿ÉÒÔ¶Ôͼ±í½øÐÐÍ϶¯ºÍËõ·Å²Ù×÷£¬ÓÃÆðÀ´·Ç³£Áé»î¡£MPAndroidChartͬÑùÓµÓг£ÓõÄͼ±íÀàÐÍ£ºÏßÐÍͼ¡¢±ýͼ¡¢Öù״ͼºÍÉ¢µãͼ¡£
mpandroidchartlibrary.jar°üÏÂÔصØÖ·£º
https://github.com/PhilJay/MPAndroidChart/releases
¡¡¡¡ÏÂÃæÖ÷ҪʵÏÖÒÔϱý״ͼ£º
¡¡¡¡1.´ÓÉÏÃæµÄµØÖ·ÖÐÏÂÔØ×îÐÂmpandroidchartlibrary-2-0-8.jar°ü£¬ È»ºócopyµ½ÏîÄ¿µÄlibsÖÐ
¡¡¡¡2. ¶¨ÒåxmlÎļþ
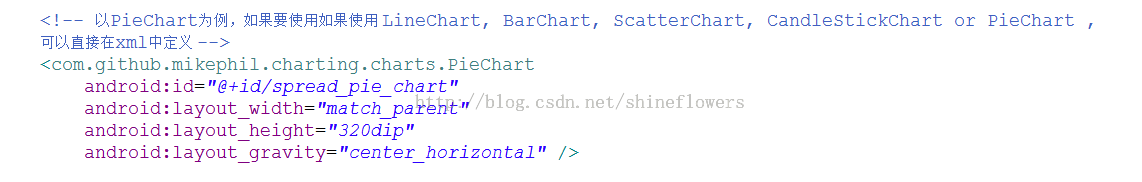
3. Ö÷ÒªJavaÂß¼´úÂëÈçÏ¡£
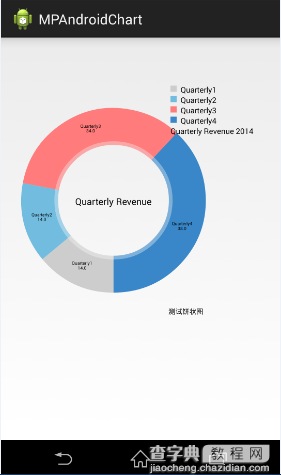
importjava.util.ArrayList; importcom.github.mikephil.charting.charts.PieChart; importcom.github.mikephil.charting.components.Legend; importcom.github.mikephil.charting.components.Legend.LegendPosition; importcom.github.mikephil.charting.data.Entry; importcom.github.mikephil.charting.data.PieData; importcom.github.mikephil.charting.data.PieDataSet; import android.support.v7.app.ActionBarActivity; importandroid.graphics.Color; importandroid.os.Bundle; importandroid.util.DisplayMetrics; public class MainActivity extends ActionBarActivity { privatePieChartmChart; @Override protected void onCreate(Bundle savedInstanceState) { super.onCreate(savedInstanceState); setContentView(R.layout.activity_main); mChart = (PieChart) findViewById(R.id.spread_pie_chart); PieDatamPieData = getPieData(4, 100); showChart(mChart, mPieData); } private void showChart(PieChartpieChart, PieDatapieData) { pieChart.setHoleColorTransparent(true); pieChart.setHoleRadius(60f); //°ë¾¶ pieChart.setTransparentCircleRadius(64f); // °ë͸Ã÷Ȧ //pieChart.setHoleRadius(0) //ʵÐÄÔ² pieChart.setDescription("²âÊÔ±ý״ͼ"); // mChart.setDrawYValues(true); pieChart.setDrawCenterText(true); //±ý״ͼÖмä¿ÉÒÔÌí¼ÓÎÄ×Ö pieChart.setDrawHoleEnabled(true); pieChart.setRotationAngle(90); // ³õʼÐýת½Ç¶È // draws the corresponding description value into the slice // mChart.setDrawXValues(true); // enable rotation of the chart by touch pieChart.setRotationEnabled(true); // ¿ÉÒÔÊÖ¶¯Ðýת // display percentage values pieChart.setUsePercentValues(true); //ÏÔʾ³É°Ù·Ö±È // mChart.setUnit(" "); // mChart.setDrawUnitsInChart(true); // add a selection listener // mChart.setOnChartValueSelectedListener(this); // mChart.setTouchEnabled(false); // mChart.setOnAnimationListener(this); pieChart.setCenterText("Quarterly Revenue"); //±ý״ͼÖмäµÄÎÄ×Ö //ÉèÖÃÊý¾Ý pieChart.setData(pieData); // undo all highlights // pieChart.highlightValues(null); // pieChart.invalidate(); Legend mLegend = pieChart.getLegend(); //ÉèÖñÈÀýͼ mLegend.setPosition(LegendPosition.RIGHT_OF_CHART); //×îÓÒ±ßÏÔʾ // mLegend.setForm(LegendForm.LINE); //ÉèÖñÈÀýͼµÄÐÎ×´£¬Ä¬ÈÏÊÇ·½ÐÎ mLegend.setXEntrySpace(7f); mLegend.setYEntrySpace(5f); pieChart.animateXY(1000, 1000); //ÉèÖö¯» // mChart.spin(2000, 0, 360); } /** * * @param count ·Ö³É¼¸²¿·Ö * @param range */ privatePieDatagetPieData(int count, float range) { ArrayList<String>xValues = new ArrayList<String>(); //xValsÓÃÀ´±íʾÿ¸ö±ý¿éÉϵÄÄÚÈÝ for (inti = 0; i< count; i++) { xValues.add("Quarterly" + (i + 1)); //±ý¿éÉÏÏÔʾ³ÉQuarterly1, Quarterly2, Quarterly3, Quarterly4 } ArrayList<Entry>yValues = new ArrayList<Entry>(); //yValsÓÃÀ´±íʾ·âװÿ¸ö±ý¿éµÄʵ¼ÊÊý¾Ý // ±ýͼÊý¾Ý /** * ½«Ò»¸ö±ýÐÎͼ·Ö³ÉËIJ¿·Ö£¬ËIJ¿·ÖµÄÊýÖµ±ÈÀýΪ14:14:34:38 * ËùÒÔ 14´ú±íµÄ°Ù·Ö±È¾ÍÊÇ14% */ float quarterly1 = 14; float quarterly2 = 14; float quarterly3 = 34; float quarterly4 = 38; yValues.add(new Entry(quarterly1, 0)); yValues.add(new Entry(quarterly2, 1)); yValues.add(new Entry(quarterly3, 2)); yValues.add(new Entry(quarterly4, 3)); //yÖáµÄ¼¯ºÏ PieDataSetpieDataSet = new PieDataSet(yValues, "Quarterly Revenue 2014"/*ÏÔʾÔÚ±ÈÀýͼÉÏ*/); pieDataSet.setSliceSpace(0f); //ÉèÖøö±ý״ͼ֮¼äµÄ¾àÀë ArrayList<Integer> colors = new ArrayList<Integer>(); // ±ýͼÑÕÉ« colors.add(Color.rgb(205, 205, 205)); colors.add(Color.rgb(114, 188, 223)); colors.add(Color.rgb(255, 123, 124)); colors.add(Color.rgb(57, 135, 200)); pieDataSet.setColors(colors); DisplayMetrics metrics = getResources().getDisplayMetrics(); floatpx = 5 * (metrics.densityDpi / 160f); pieDataSet.setSelectionShift(px); // Ñ¡ÖÐ̬¶à³öµÄ³¤¶È PieDatapieData = new PieData(xValues, pieDataSet); returnpieData; } }
Ч¹ûͼÈçÏ£º
MPAndroidChart¿ªÔ´Í¼±í¿âÖ®ÕÛÏßͼ
1. ½«mpandroidchartlibrary-2-0-8.jar°ücopyµ½ÏîÄ¿µÄlibsÖÐ
2. ¶¨ÒåxmlÎļþ
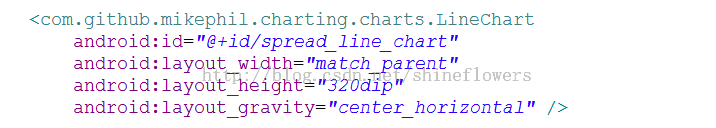
3. Ö÷ÒªJavaÂß¼´úÂëÈçÏ¡£
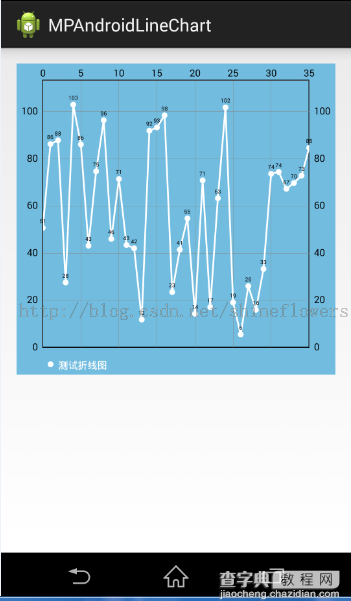
packagecom.example.mpandroidlinechart; importjava.util.ArrayList; importcom.github.mikephil.charting.charts.LineChart; importcom.github.mikephil.charting.components.Legend; importcom.github.mikephil.charting.components.Legend.LegendForm; importcom.github.mikephil.charting.data.Entry; importcom.github.mikephil.charting.data.LineData; importcom.github.mikephil.charting.data.LineDataSet; import android.support.v7.app.ActionBarActivity; importandroid.graphics.Color; importandroid.os.Bundle; public class MainActivity extends ActionBarActivity { privateLineChartmLineChart; // private Typeface mTf; @Override protected void onCreate(Bundle savedInstanceState) { super.onCreate(savedInstanceState); setContentView(R.layout.activity_main); mLineChart = (LineChart) findViewById(R.id.spread_line_chart); // mTf = Typeface.createFromAsset(getAssets(), "OpenSans-Bold.ttf"); LineDatamLineData = getLineData(36, 100); showChart(mLineChart, mLineData, Color.rgb(114, 188, 223)); } // ÉèÖÃÏÔʾµÄÑùʽ private void showChart(LineChartlineChart, LineDatalineData, int color) { lineChart.setDrawBorders(false); //ÊÇ·ñÔÚÕÛÏßͼÉÏÌí¼Ó±ß¿ò // no description text lineChart.setDescription("");// Êý¾ÝÃèÊö // Èç¹ûûÓÐÊý¾ÝµÄʱºò£¬»áÏÔʾÕâ¸ö£¬ÀàËÆlistviewµÄemtpyview lineChart.setNoDataTextDescription("You need to provide data for the chart."); // enable / disable grid background lineChart.setDrawGridBackground(false); // ÊÇ·ñÏÔʾ±í¸ñÑÕÉ« lineChart.setGridBackgroundColor(Color.WHITE& 0x70FFFFFF); // ±í¸ñµÄµÄÑÕÉ«£¬ÔÚÕâÀïÊÇÊǸøÑÕÉ«ÉèÖÃÒ»¸ö͸Ã÷¶È // enable touch gestures lineChart.setTouchEnabled(true); // ÉèÖÃÊÇ·ñ¿ÉÒÔ´¥Ãþ // enable scaling and dragging lineChart.setDragEnabled(true);// ÊÇ·ñ¿ÉÒÔÍÏק lineChart.setScaleEnabled(true);// ÊÇ·ñ¿ÉÒÔËõ·Å // if disabled, scaling can be done on x- and y-axis separately lineChart.setPinchZoom(false);// lineChart.setBackgroundColor(color);// ÉèÖñ³¾° // add data lineChart.setData(lineData); // ÉèÖÃÊý¾Ý // get the legend (only possible after setting data) Legend mLegend = lineChart.getLegend(); // ÉèÖñÈÀýͼ±êʾ£¬¾ÍÊÇÄǸöÒ»×éyµÄvalueµÄ // modify the legend ... // mLegend.setPosition(LegendPosition.LEFT_OF_CHART); mLegend.setForm(LegendForm.CIRCLE);// Ñùʽ mLegend.setFormSize(6f);// ×ÖÌå mLegend.setTextColor(Color.WHITE);// ÑÕÉ« // mLegend.setTypeface(mTf);// ×ÖÌå lineChart.animateX(2500); // Á¢¼´Ö´ÐеĶ¯»,xÖá } /** * Éú³ÉÒ»¸öÊý¾Ý * @param count ±íʾͼ±íÖÐÓжàÉÙ¸ö×ø±êµã * @param range ÓÃÀ´Éú³ÉrangeÒÔÄÚµÄËæ»úÊý * @return */ privateLineDatagetLineData(int count, float range) { ArrayList<String>xValues = new ArrayList<String>(); for (inti = 0; i< count; i++) { // xÖáÏÔʾµÄÊý¾Ý£¬ÕâÀïĬÈÏʹÓÃÊý×ÖϱêÏÔʾ xValues.add("" + i); } // yÖáµÄÊý¾Ý ArrayList<Entry>yValues = new ArrayList<Entry>(); for (inti = 0; i< count; i++) { float value = (float) (Math.random() * range) + 3; yValues.add(new Entry(value, i)); } // create a dataset and give it a type // yÖáµÄÊý¾Ý¼¯ºÏ LineDataSetlineDataSet = new LineDataSet(yValues, "²âÊÔÕÛÏßͼ" /*ÏÔʾÔÚ±ÈÀýͼÉÏ*/); // mLineDataSet.setFillAlpha(110); // mLineDataSet.setFillColor(Color.RED); //ÓÃyÖáµÄ¼¯ºÏÀ´ÉèÖòÎÊý lineDataSet.setLineWidth(1.75f); // Ïß¿í lineDataSet.setCircleSize(3f);// ÏÔʾµÄÔ²ÐδóС lineDataSet.setColor(Color.WHITE);// ÏÔʾÑÕÉ« lineDataSet.setCircleColor(Color.WHITE);// Ô²ÐεÄÑÕÉ« lineDataSet.setHighLightColor(Color.WHITE); // ¸ßÁÁµÄÏßµÄÑÕÉ« ArrayList<LineDataSet>lineDataSets = new ArrayList<LineDataSet>(); lineDataSets.add(lineDataSet); // add the datasets // create a data object with the datasets LineDatalineData = new LineData(xValues, lineDataSets); returnlineData; } }
Ч¹ûͼÈçÏ£º
MPAndroidChart¿ªÔ´Í¼±í¿âÖ®Öù״ͼ
1. ½«mpandroidchartlibrary-2-0-8.jar°ücopyµ½ÏîÄ¿µÄlibsÖÐ
2. ¶¨ÒåxmlÎļþ
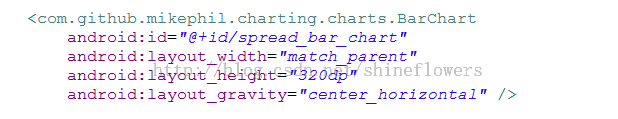
3. Ö÷ÒªJavaÂß¼´úÂëÈçÏ¡£
packagecom.jackie.mpandoidbarchart; importjava.util.ArrayList; importcom.github.mikephil.charting.charts.BarChart; importcom.github.mikephil.charting.charts.LineChart; importcom.github.mikephil.charting.components.Legend; importcom.github.mikephil.charting.components.Legend.LegendForm; importcom.github.mikephil.charting.components.XAxis; importcom.github.mikephil.charting.components.XAxis.XAxisPosition; importcom.github.mikephil.charting.data.BarData; importcom.github.mikephil.charting.data.BarDataSet; importcom.github.mikephil.charting.data.BarEntry; import android.support.v7.app.ActionBarActivity; importandroid.graphics.Color; importandroid.os.Bundle; public class MainActivity extends ActionBarActivity { privateBarChartmBarChart; privateBarDatamBarData; @Override protected void onCreate(Bundle savedInstanceState) { super.onCreate(savedInstanceState); setContentView(R.layout.activity_main); mBarChart = (BarChart) findViewById(R.id.spread_bar_chart); mBarData = getBarData(4, 100); showBarChart(mBarChart, mBarData); } private void showBarChart(BarChartbarChart, BarDatabarData) { barChart.setDrawBorders(false); ////ÊÇ·ñÔÚÕÛÏßͼÉÏÌí¼Ó±ß¿ò barChart.setDescription("");// Êý¾ÝÃèÊö // Èç¹ûûÓÐÊý¾ÝµÄʱºò£¬»áÏÔʾÕâ¸ö£¬ÀàËÆListViewµÄEmptyView barChart.setNoDataTextDescription("You need to provide data for the chart."); barChart.setDrawGridBackground(false); // ÊÇ·ñÏÔʾ±í¸ñÑÕÉ« barChart.setGridBackgroundColor(Color.WHITE& 0x70FFFFFF); // ±í¸ñµÄµÄÑÕÉ«£¬ÔÚÕâÀïÊÇÊǸøÑÕÉ«ÉèÖÃÒ»¸ö͸Ã÷¶È barChart.setTouchEnabled(true); // ÉèÖÃÊÇ·ñ¿ÉÒÔ´¥Ãþ barChart.setDragEnabled(true);// ÊÇ·ñ¿ÉÒÔÍÏק barChart.setScaleEnabled(true);// ÊÇ·ñ¿ÉÒÔËõ·Å barChart.setPinchZoom(false);// // barChart.setBackgroundColor();// ÉèÖñ³¾° barChart.setDrawBarShadow(true); barChart.setData(barData); // ÉèÖÃÊý¾Ý Legend mLegend = barChart.getLegend(); // ÉèÖñÈÀýͼ±êʾ mLegend.setForm(LegendForm.CIRCLE);// Ñùʽ mLegend.setFormSize(6f);// ×ÖÌå mLegend.setTextColor(Color.BLACK);// ÑÕÉ« // XÖáÉ趨 // XAxisxAxis = barChart.getXAxis(); // xAxis.setPosition(XAxisPosition.BOTTOM); barChart.animateX(2500); // Á¢¼´Ö´ÐеĶ¯»,xÖá } privateBarDatagetBarData(int count, float range) { ArrayList<String>xValues = new ArrayList<String>(); for (inti = 0; i< count; i++) { xValues.add("µÚ" + (i + 1) + "¼¾¶È"); } ArrayList<BarEntry>yValues = new ArrayList<BarEntry>(); for (inti = 0; i< count; i++) { float value = (float) (Math.random() * range/*100ÒÔÄÚµÄËæ»úÊý*/) + 3; yValues.add(new BarEntry(value, i)); } // yÖáµÄÊý¾Ý¼¯ºÏ BarDataSetbarDataSet = new BarDataSet(yValues, "²âÊÔ±ý״ͼ"); barDataSet.setColor(Color.rgb(114, 188, 223)); ArrayList<BarDataSet>barDataSets = new ArrayList<BarDataSet>(); barDataSets.add(barDataSet); // add the datasets BarDatabarData = new BarData(xValues, barDataSets); returnbarData; } } packagecom.jackie.mpandoidbarchart; importjava.util.ArrayList; importcom.github.mikephil.charting.charts.BarChart; importcom.github.mikephil.charting.charts.LineChart; importcom.github.mikephil.charting.components.Legend; importcom.github.mikephil.charting.components.Legend.LegendForm; importcom.github.mikephil.charting.components.XAxis; importcom.github.mikephil.charting.components.XAxis.XAxisPosition; importcom.github.mikephil.charting.data.BarData; importcom.github.mikephil.charting.data.BarDataSet; importcom.github.mikephil.charting.data.BarEntry; import android.support.v7.app.ActionBarActivity; importandroid.graphics.Color; importandroid.os.Bundle; public class MainActivity extends ActionBarActivity { privateBarChartmBarChart; privateBarDatamBarData; @Override protected void onCreate(Bundle savedInstanceState) { super.onCreate(savedInstanceState); setContentView(R.layout.activity_main); mBarChart = (BarChart) findViewById(R.id.spread_bar_chart); mBarData = getBarData(4, 100); showBarChart(mBarChart, mBarData); } private void showBarChart(BarChartbarChart, BarDatabarData) { barChart.setDrawBorders(false); ////ÊÇ·ñÔÚÕÛÏßͼÉÏÌí¼Ó±ß¿ò barChart.setDescription("");// Êý¾ÝÃèÊö // Èç¹ûûÓÐÊý¾ÝµÄʱºò£¬»áÏÔʾÕâ¸ö£¬ÀàËÆListViewµÄEmptyView barChart.setNoDataTextDescription("You need to provide data for the chart."); barChart.setDrawGridBackground(false); // ÊÇ·ñÏÔʾ±í¸ñÑÕÉ« barChart.setGridBackgroundColor(Color.WHITE& 0x70FFFFFF); // ±í¸ñµÄµÄÑÕÉ«£¬ÔÚÕâÀïÊÇÊǸøÑÕÉ«ÉèÖÃÒ»¸ö͸Ã÷¶È barChart.setTouchEnabled(true); // ÉèÖÃÊÇ·ñ¿ÉÒÔ´¥Ãþ barChart.setDragEnabled(true);// ÊÇ·ñ¿ÉÒÔÍÏק barChart.setScaleEnabled(true);// ÊÇ·ñ¿ÉÒÔËõ·Å barChart.setPinchZoom(false);// // barChart.setBackgroundColor();// ÉèÖñ³¾° barChart.setDrawBarShadow(true); barChart.setData(barData); // ÉèÖÃÊý¾Ý Legend mLegend = barChart.getLegend(); // ÉèÖñÈÀýͼ±êʾ mLegend.setForm(LegendForm.CIRCLE);// Ñùʽ mLegend.setFormSize(6f);// ×ÖÌå mLegend.setTextColor(Color.BLACK);// ÑÕÉ« // XÖáÉ趨 // XAxisxAxis = barChart.getXAxis(); // xAxis.setPosition(XAxisPosition.BOTTOM); barChart.animateX(2500); // Á¢¼´Ö´ÐеĶ¯»,xÖá } privateBarDatagetBarData(int count, float range) { ArrayList<String>xValues = new ArrayList<String>(); for (inti = 0; i< count; i++) { xValues.add("µÚ" + (i + 1) + "¼¾¶È"); } ArrayList<BarEntry>yValues = new ArrayList<BarEntry>(); for (inti = 0; i< count; i++) { float value = (float) (Math.random() * range/*100ÒÔÄÚµÄËæ»úÊý*/) + 3; yValues.add(new BarEntry(value, i)); } // yÖáµÄÊý¾Ý¼¯ºÏ BarDataSetbarDataSet = new BarDataSet(yValues, "²âÊÔ±ý״ͼ"); barDataSet.setColor(Color.rgb(114, 188, 223)); ArrayList<BarDataSet>barDataSets = new ArrayList<BarDataSet>(); barDataSets.add(barDataSet); // add the datasets BarDatabarData = new BarData(xValues, barDataSets); returnbarData; } }
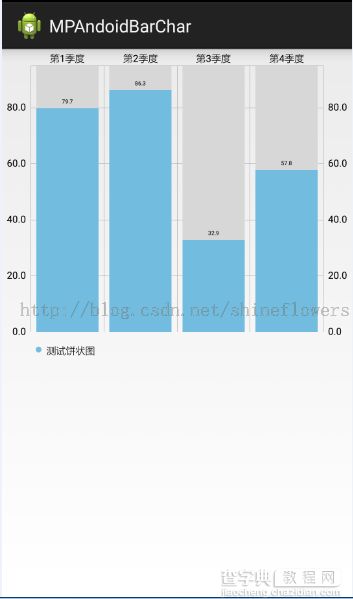
Ч¹ûͼÈçÏ£º
ÒÔÉÏËùÊöÊÇС±à¸ø´ó¼Ò½éÉܵÄMPAndroidChart¿ªÔ´Í¼±í¿âµÄʹÓýéÉÜÖ®±ý״ͼ¡¢ÕÛÏßͼºÍÖù״ͼµÄÏà¹Ø֪ʶ£¬Ï£Íû¶Ô´ó¼ÒÓÐËù°ïÖú¡£